Wednesday, July 29, 2026
Busiest Office Days: What Weekday Data Shows


Tuesday is the busiest office day in many recent datasets. Wednesday and Thursday are usually close behind, while Friday is commonly the quietest. But there is no universal best day. A busy building is only useful when the right colleagues, rooms, and support are available for the work you need to do.
The evidence below compares survey responses, access events, mobile-location estimates, and occupancy sensors. These measures point to a midweek pattern, but their percentages are not interchangeable. Use them as external benchmarks, then make the scheduling decision with your own team data.
The short answer: midweek is usually busiest
- Typical pattern: Tuesday, Wednesday, and Thursday form the busiest part of the week in many office datasets.
- Common low point: Friday is usually the quietest day, although Monday is also below the midweek peak in many locations.
- Important exception: Some Australian, industry, and company datasets peak on Monday, Wednesday, or Thursday.
- Practical rule: Choose a day for useful teammate overlap and capacity, not because an external benchmark says it is popular.
Before comparing rates, decide what the denominator means. The office attendance rate guide separates people in scope, usable capacity, planned attendance, and observed attendance so unlike measures do not get combined.
What current weekday data shows
Australia: Tuesday peaks in Perth, but national hours differ
A current Perth weekday survey reports that 72% of 809 employed respondents worked in the office on Tuesday. Friday was the most common work-from-home day at 24%. Respondents could select both home and office for the same day, so the figures describe blended work patterns rather than mutually exclusive daily locations.
A separate University of Sydney analysis reports a different pattern among hybrid workers in an October 2024 national survey. Average office time was highest on Monday and Wednesday at 5.3 hours, followed by Tuesday and Thursday at 4.9 hours, then Friday at 4.6 hours. The source reports a sample of 981 for that survey. This is time spent in the office, not the share of people attending.
United States: access and location data show a midweek crest
For the week displayed on July 6, 2026, the Kastle weekday barometer put Tuesday at 64.7% of its pre-pandemic access baseline across ten U.S. cities. Eight cities peaked on Tuesday. New York and Houston peaked on Wednesday, and Kastle noted local transport, weather, and event disruptions. One week can be informative, but it is not a permanent benchmark.
Gallup reported in October 2023 that hybrid workers were most commonly onsite on Tuesday, Wednesday, and Thursday. Monday attendance was about 49%, and Friday attendance was about one-third. The article does not state the weekday chart sample size, so those figures should be presented as Gallup estimates rather than a universal workforce rate.
A March 2026 preprint analysed about 41 billion mobile geolocation records from 73.5 million individuals across five large U.S. metropolitan areas. The authors found a Tuesday-to-Thursday midweek peak in 2023. The method estimates office-based workdays from location traces, which is broader than badge or booking data and brings different classification limits.
Germany and Europe: the shape is similar, not identical
The ifo Business Survey asked more than 9,000 German companies about their main work-from-home days in October 2023. Friday was selected by 55% and Monday by 35%; Tuesday, Wednesday, and Thursday were usually office days. Multiple responses were allowed, so the percentages should not be added to 100.
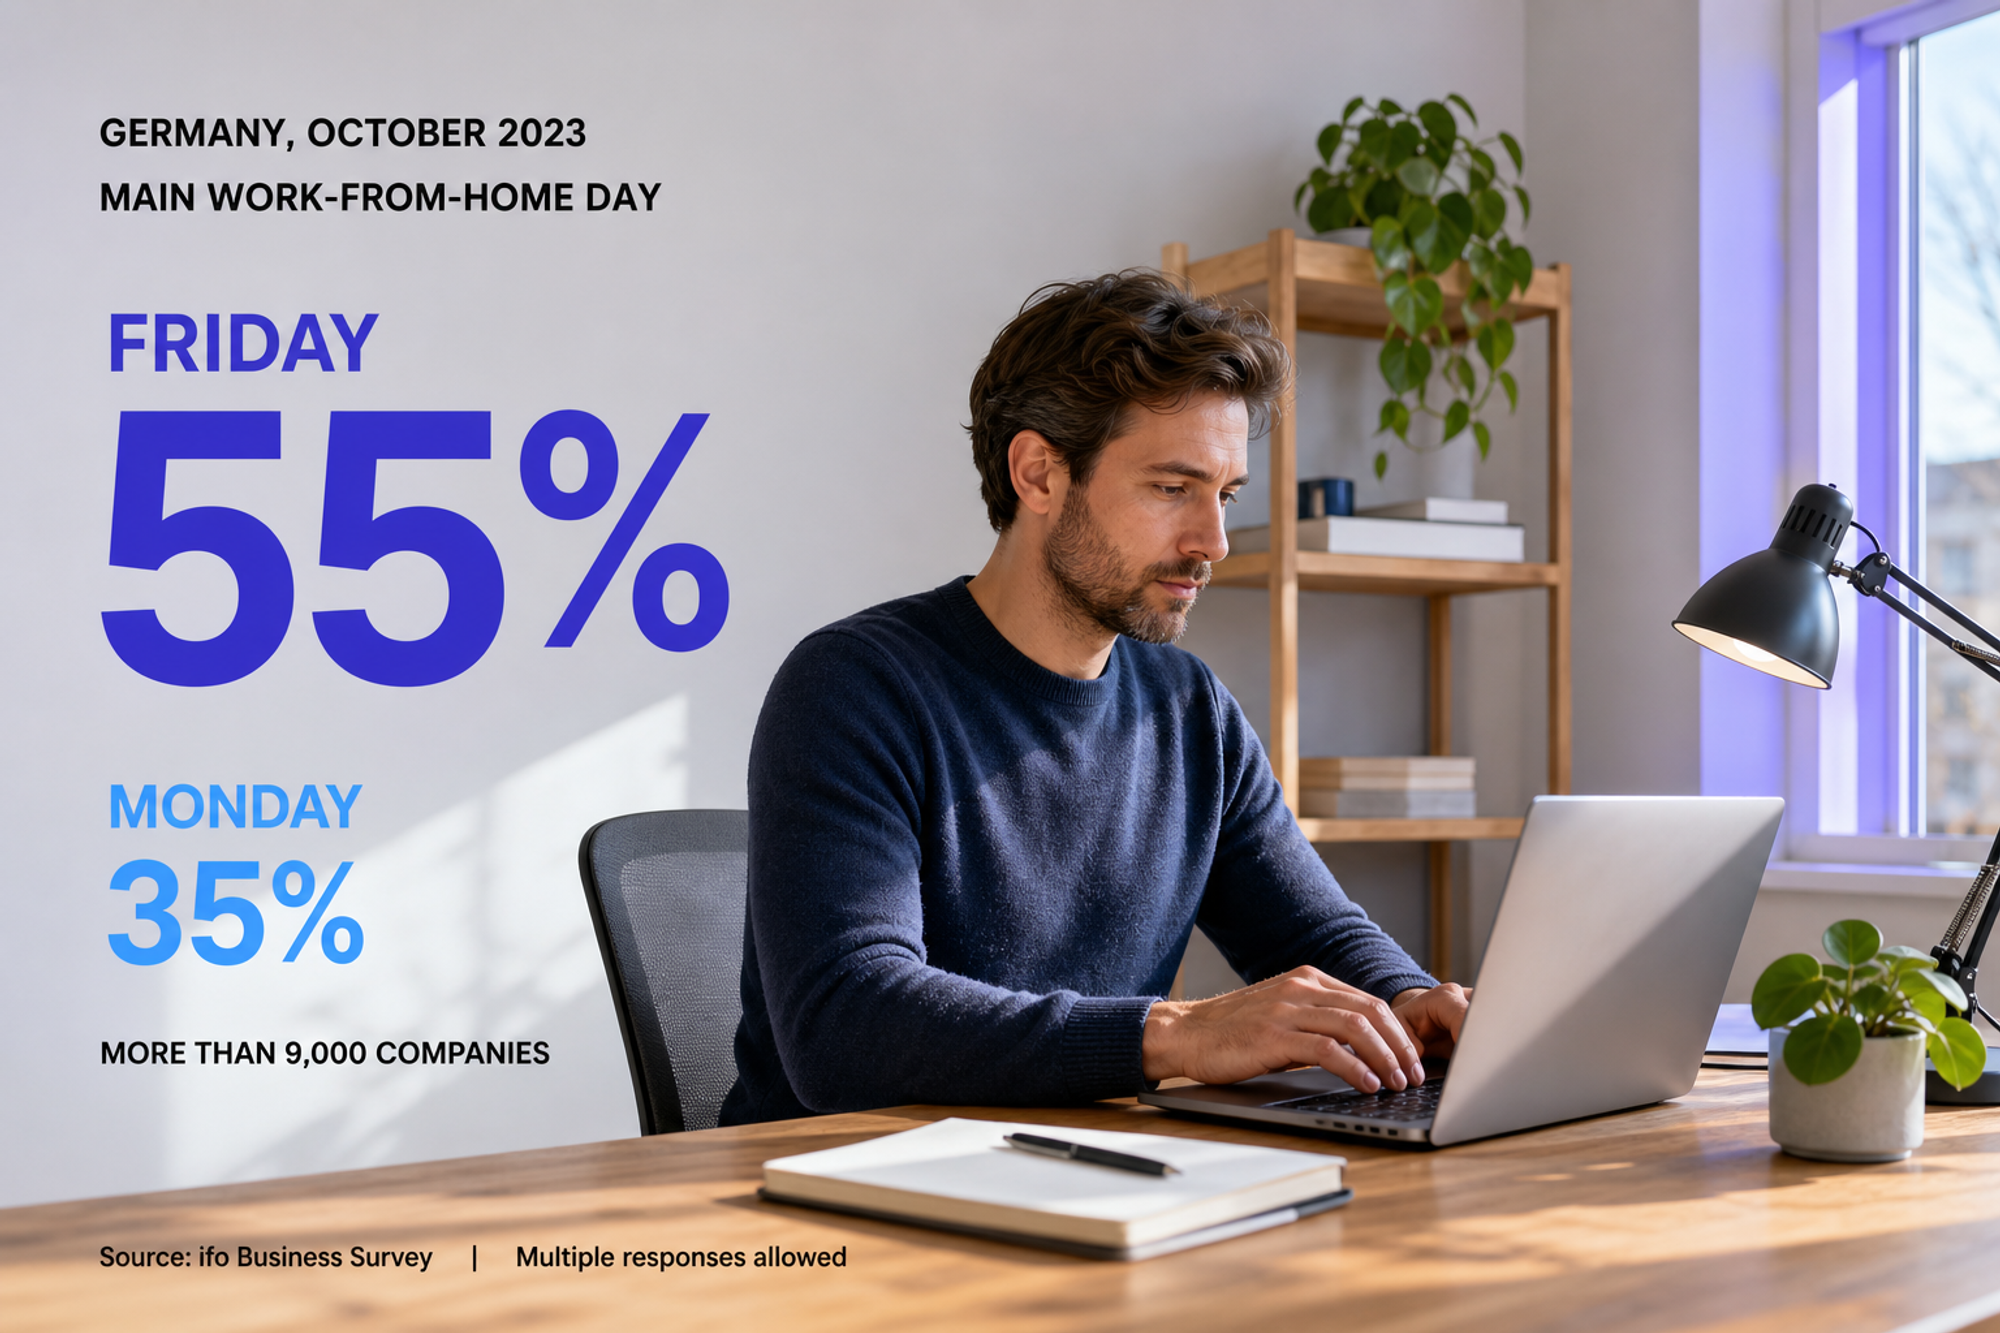
Accessible transcription: Germany, October 2023. In the ifo Business Survey of more than 9,000 companies, 55% selected Friday and 35% selected Monday as a main work-from-home day. The survey allowed multiple responses.
CBRE surveyed more than 100 organisations that together used about 2.5 million square metres of office space, with most headquarters in the Netherlands. Its 2024 occupier benchmark found Tuesday and Thursday busiest, while Monday, Wednesday, and Friday were quieter. That result differs from sources that group all three midweek days together.
Global sensor data: Tuesday leads, with sector exceptions
The VergeSense 2025 index covers anonymous sensor data from January through December 2024 across more than 200 enterprise customers, 190,000 spaces, 156 million square feet, and 50 countries. Tuesday had the highest average capacity usage and Friday the lowest in the Americas, Asia Pacific, and Europe, Middle East, and Africa. Technology and media was an exception, with Wednesday the peak day.
One Norwegian fintech case adds a smaller, older example. Access-card data from a company of roughly 650 people showed Tuesday and Wednesday as popular days in a typical week in March 2022. A single company cannot establish a general weekday rule, but it illustrates how an explicit schedule can shape the observed peak.
Why the datasets disagree
The apparent contradictions are mostly measurement differences, not proof that one source is wrong.
- Signal: A plan, booking, survey response, badge event, location estimate, and occupancy sensor each measure a different behaviour.
- Denominator: Gallup reports a share of hybrid workers, Kastle compares access activity with a pre-pandemic baseline, and VergeSense reports capacity usage.
- Time window: A single displayed week can move because of holidays, weather, events, office closures, or policy changes. Annual data smooths those effects but can hide change.
- Geography and industry: Commutes, public holidays, office design, role mix, and local norms shift weekday patterns.
- Policy: Required days can create a peak even when employees would have chosen another day. A measured peak describes what happened under that policy.
Do not place percentages from different signals into one ranking. Label each measure, keep the numerator and denominator beside it, and compare like with like over the same period.
The busiest day is not automatically the best day
Building traffic answers a space question. A team schedule answers a coordination question. Those questions overlap, but they are not the same.
A PNAS study used anonymised building-access data from about 43,000 employees at one global technology company. Employee attendance was 29% higher when their manager was present and rose 16% with a one-standard-deviation increase in teammate attendance. These are associations in one company, not proof that managers cause attendance.
A separate study of 17 agile teams found that high office presence did not guarantee co-presence. Some teams had high average attendance but infrequent face-to-face overlap because their office days were fragmented.

The illustration is qualitative and contains no statistics. The busy building on the left has many people on separate paths. The quieter calendar on the right brings four collaborators to one table. The useful measure is whether the people and resources required for the work overlap, not whether the building reaches its highest headcount.
Copy-and-use weekday decision card
Use this compact decision card before naming an anchor day or changing workplace services. Four comparable weeks is an Officedays editorial starting point, not a validated statistical threshold. Extend the window when holidays, closures, launches, or seasonal work make it unrepresentative.
1. Write the decision
- Decision: What will change if one weekday is busier? Examples include room staffing, catering, team overlap, a shared workshop day, or opening hours.
- Population: Name the office, team, or eligible group. Do not mix locations or teams with different schedules.
2. Define the signal
- Planned measure: Count people who say they intend to attend by a fixed cutoff.
- Observed measure: If needed, count a clearly named access, check-in, or sensor signal. Do not relabel plans as actual attendance.
- Denominator: Use people in scope for attendance, or usable capacity for utilization.
3. Collect comparable weekdays
- Record Monday through Friday for the same population and time window.
- Flag public holidays, closures, large events, travel periods, and missing data.
- Keep raw counts beside every rate, then aggregate counts before calculating a multiweek percentage.
4. Add overlap and capacity
- List the collaborators or roles whose in-person overlap matters for the decision.
- Check desks, rooms, equipment, accessibility, and service constraints.
- Use the office-day overlap worksheet when a team needs to compare critical collaborator pairs across candidate days.
5. Choose with a written rule
- For services, plan to the observed peak plus an explicit contingency.
- For team collaboration, choose the highest useful overlap day that passes every capacity guardrail.
- If the day will be shared regularly, use the anchor day setup checklist to state scope, purpose, exceptions, and review date.
6. Review the result
- After four comparable weeks, ask whether the intended work happened, whether capacity held, and whether exceptions were visible early enough.
- Continue, change one input, or end the arrangement. Do not turn a coordination measure into an unexplained individual performance score.
Compact reporting template
- Period: dates, weekdays, cutoff, and excluded days.
- Scope: office, team, eligible population, and usable capacity.
- Signal: plan, booking, check-in, badge, sensor, or another named source.
- Weekday result: raw numerator, denominator, rate, and data-quality note for each day.
- Overlap result: critical collaborators present together, stated as a count and a defined percentage.
- Decision: selected day, operational change, reason, owner, and review date.
This template is a reporting framework, not an industry benchmark. Preserve the raw counts so a future reviewer can reproduce the result.
How to act on the weekday pattern
- Tuesday to Thursday peak: Check meeting-room and service bottlenecks. Add capacity or spread optional activities only when the bottleneck is real.
- Monday opportunity: A deliberately chosen Monday can create overlap without the usual midweek crowd, but only if the required people commit to it.
- Friday quiet: A quieter office may suit focused work or a small group. It will not create spontaneous cross-team overlap if few colleagues attend.
- Local exception: If your own data peaks on another day, trust the well-defined local measure over a broad external average.
Make the weekly plan visible
Once a team has chosen its usual pattern, keep weekly exceptions visible. Officedays lets Slack teams mark the weekdays they plan to attend in a shared message. That is a coordination signal, not proof of measured attendance. The Officedays support guide documents the current commands, scheduling behaviour, multi-office setup, and product limits.
Use the external weekday evidence to form a hypothesis. Use your team plan and clearly defined local measures to make the decision.
Sources and methodology
This article is a public-source synthesis, not original Officedays research. Sources were checked on July 29, 2026. Weekday findings are presented with their original signal and scope because survey responses, office hours, access activity, mobile-location estimates, and sensor capacity usage cannot be merged into one percentage. The decision card is an Officedays editorial framework and has not been validated as a scientific instrument.
- Between home and office. Department of Transport and Major Infrastructure, Western Australia. Publication date and survey date not shown on the page. Perth, Australia; n=809 employed respondents. Used for the Tuesday office and Friday home figures. Accessed July 29, 2026.
- Hybrid workers: evidence to support this new mainstream workforce in 2025. University of Sydney, April 1, 2025. Australia; October 2024 national survey, n=981. Used for average office hours by weekday. Accessed July 29, 2026.
- Occupancy by Day of Week. Kastle Systems. Displayed data dated July 6, 2026. Ten U.S. cities; access activity relative to a pre-pandemic baseline; building count not stated on the page. Used for the current weekly Tuesday peak. Accessed July 29, 2026.
- The Future of the Office Has Arrived: It Is Hybrid. Gallup, October 8, 2023. United States; self-reported hybrid-worker data, with weekday chart sample size not stated on the article page. Used for the Tuesday-to-Thursday pattern and Monday and Friday estimates. Accessed July 29, 2026.
- Mapping the Midweek Mountain: The New Geography of Hybrid Work. Guo, Jiang, Pothuru, and Yang, preprint submitted March 19, 2026. Five large U.S. metropolitan areas; about 41 billion mobile geolocation records from 73.5 million individuals; data years 2019, 2022, and 2023. Used for the midweek pattern. Accessed July 29, 2026.
- Friday and Monday Most Common Days for Working from Home in Germany. ifo Institute, December 7, 2023. Germany; October 2023 business survey of more than 9,000 companies; multiple responses allowed. Used for the 55% Friday and 35% Monday figures. Accessed July 29, 2026.
- Office Occupier Benchmark Report 2024. CBRE, July 11, 2024. More than 100 organisations using about 2.5 million square metres of office space; 80 headquartered in the Netherlands, 14 elsewhere in Europe, and 12 outside Europe. Used for the Tuesday and Thursday peak. Accessed July 29, 2026.
- 2025 Workplace Occupancy and Utilization Index. VergeSense, published for 2025 using January to December 2024 data. More than 200 enterprise customers, 190,000 spaces, 156 million square feet, and 50 countries; anonymous occupancy-sensor data. Used for regional and industry weekday patterns. Accessed July 29, 2026.
- Hybrid Meetings in Agile Software Development. Smite and colleagues, published 2024. One Norwegian fintech company of roughly 650 people; access-card example from a typical week in March 2022, plus observations and interviews. Used for the Tuesday and Wednesday company example. Accessed July 29, 2026.
- Navigating the New Normal: Examining Coattendance in a Hybrid Work Environment. Charpignon and colleagues, Proceedings of the National Academy of Sciences, published December 11, 2023. One global technology company; anonymised building-access data from about 43,000 employees. Used for the manager and teammate attendance associations. Accessed July 29, 2026.
- Understanding the Difference between Office Presence and Co-presence in Team Member Interactions. Moe, Ulsaker, Smite, Hildrum, and Ay, preprint submitted September 23, 2023. One large telecommunications company; 17 agile teams; office access-card data; geography not stated on the abstract page. Used for the presence versus co-presence distinction. Accessed July 29, 2026.