Sunday, July 26, 2026
Office Attendance Rate: Formula, Examples, and Reporting Template

Office attendance rate is the share of people in a defined population who are in the office during a defined period. The basic formula is actual office visitors ÷ people in scope × 100. But the result is useful only when you also state the numerator, denominator, time window, and attendance signal.
For example, 24 office visitors from a population of 80 gives a 30% daily office show-up rate. If the office has 40 usable places, the same 24 visitors also produce 60% utilization. Both numbers are correct. They answer different questions.
The short office attendance rate formula
CBRE occupancy definitions separate office show-up rate from office utilization rate:
- Office show-up rate = actual office visitors ÷ people in scope × 100. This measures demand relative to the population.
- Office utilization rate = actual office visitors ÷ usable office capacity × 100. This measures demand relative to space.
Use “office attendance rate” as a plain-language label only after you define which denominator you mean. In a dashboard, prefer the more specific metric name.
Four office attendance metrics not to mix
A hybrid workplace usually has at least two kinds of signal: a plan for the future and an observation about what happened. Microsoft documents this distinction as user-entered planned work location and manually or system-detected actual work location. Its workplace check-in feature is explicitly designed for coordination, not historical attendance monitoring. That limitation is important when choosing a data source. See the current Microsoft Places documentation for the exact feature behavior and controls.
1. Planned office rate
Planned office rate = people who intend to attend ÷ people in scope × 100.
Use it to forecast desks, rooms, food, access support, or teammate overlap. Call it planned, expected, or intended. Do not relabel a voluntary plan as actual attendance.
2. Office show-up rate
Office show-up rate = people observed in the office ÷ people in scope × 100.
Use it to describe office demand relative to headcount or another declared population. The numerator might come from check-in, badge, Wi-Fi, or another source. State the source and its coverage because each signal has blind spots.
3. Office utilization rate
Office utilization rate = people observed in the office ÷ usable capacity × 100.
Use it for a space question: how much of the available capacity was used? Define usable capacity for the report period. A floor with 100 desks but only 80 available during refurbishment has a denominator of 80 if the metric is meant to reflect that day’s usable supply.
4. Plan realization
Plan realization = people who planned and then arrived ÷ people who planned × 100.
This is an Officedays operational definition, not a universal industry standard. It helps a workplace operator estimate how closely planned demand matched observed arrivals. Keep walk-ins as a separate count so they do not inflate the numerator.
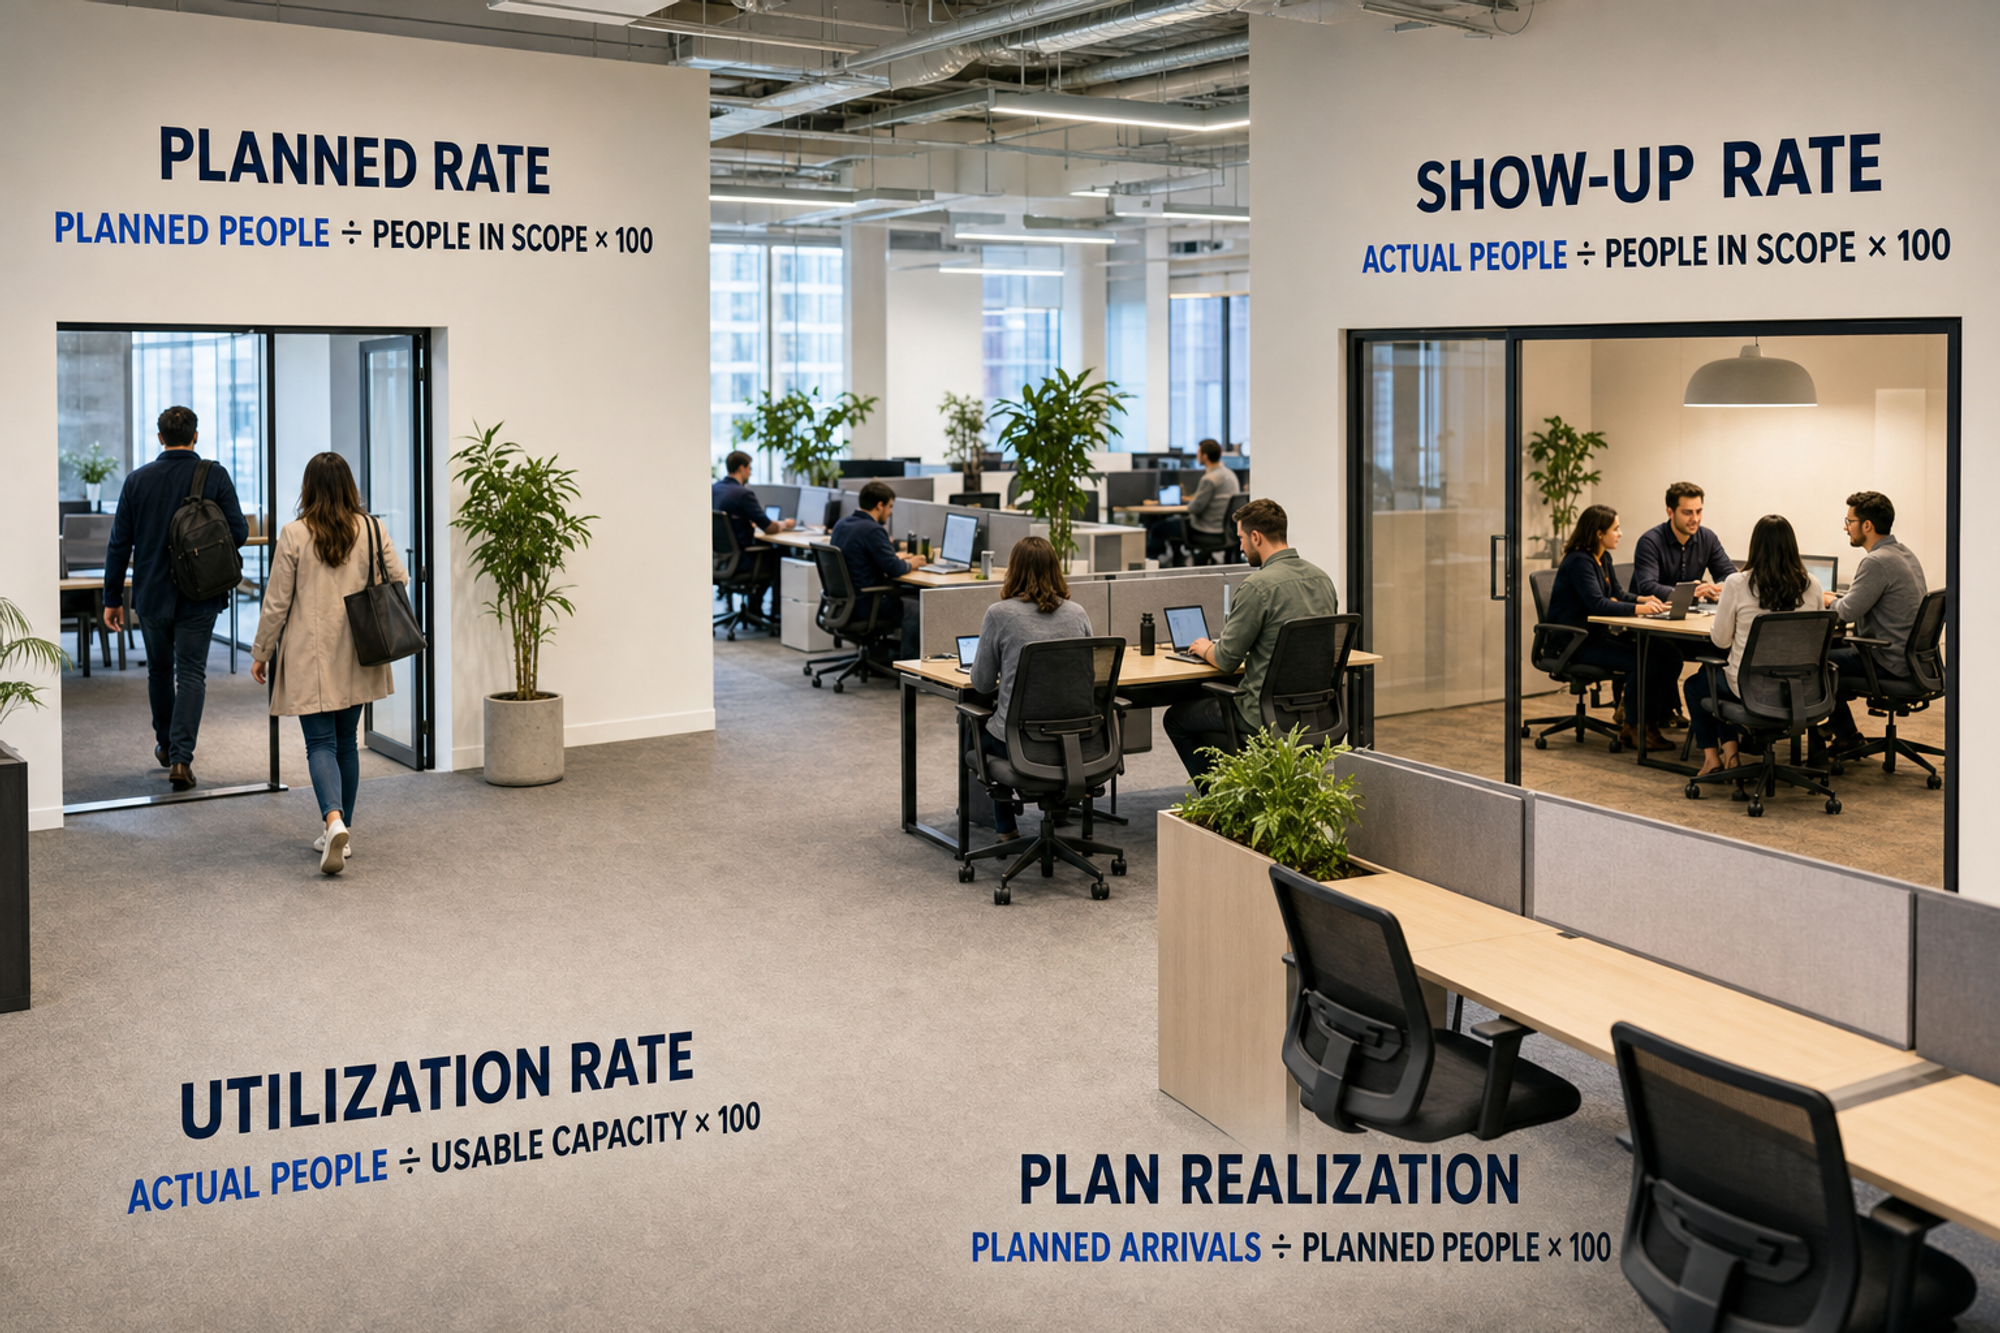
The image is a ratio map. To calculate a percentage, divide each numerator by its denominator and multiply by 100. Planned rate uses planned people over people in scope. Show-up rate uses actual people over people in scope. Utilization uses actual people over usable capacity. Plan realization uses planned arrivals over planned people.
Worked example with four correct answers
Consider one office on a Wednesday. The numbers below are illustrative, not customer data or a benchmark:
- 80 people are in scope.
- 40 usable places are available.
- 32 people say they plan to attend.
- 24 people are observed in the office.
- Of those 24 people, 22 had planned to attend and 2 were walk-ins.
The calculations are:
- Planned office rate: 32 ÷ 80 × 100 = 40%.
- Office show-up rate: 24 ÷ 80 × 100 = 30%.
- Office utilization rate: 24 ÷ 40 × 100 = 60%.
- Plan realization: 22 ÷ 32 × 100 = 68.75%, or 69% when rounded to a whole percentage.
Do not choose the highest or lowest number for a headline. Choose the metric that matches the decision. Workplace teams planning tomorrow need the 40% planned rate. A space review needs the 60% utilization rate. A coordination review may need the 69% plan realization rate plus the two walk-ins.
Choose the denominator before collecting data
The denominator defines the meaning of the result. Write it in one sentence before you build a spreadsheet or dashboard.
People in scope
Use a stable population for show-up or planned attendance. Examples include employees assigned to one office, members of a team, or people eligible to use a location. Document how you handle starters, leavers, leave, travel, contractors, and people attached to more than one office.
Usable capacity
Use the capacity that was actually available for the period, not a stale design number. State whether the measure covers desks, seats, building access, or another constraint. Attendance and capacity are separate inputs.
Planned people
Use the people who had an active plan at the cutoff time. Record the cutoff, such as 3 pm on the previous business day. A moving cutoff makes week-to-week comparisons difficult to interpret.
Choose the numerator and signal
The word “actual” can sound more precise than the collection method deserves. The safer practice is to name the signal.
- Self-reported plan: useful for coordination and forecasting, but it records intent.
- Manual check-in: closer to observed presence, but completion may vary.
- Badge event: shows an access event, not necessarily time spent or use of a particular workspace.
- Wi-Fi or device signal: can indicate device presence within configured limits, but coverage and device behavior affect interpretation.
- Sensor count: can estimate people or space use without identifying everyone, but the unit, placement, and accuracy still need documentation.
Calven analytics documentation illustrates why the categories matter by separating checked-in people, walk-ins, and no-shows. A Cisco implementation guide also describes how badge, Wi-Fi, and sensor inputs answer different questions and depend on system design. These are examples of platform terminology, not universal standards.
Do not average percentages blindly
When the denominator changes, a simple average of daily percentages can be wrong. Suppose Monday has 10 visitors from 20 people in scope, a 50% show-up rate. Tuesday has 30 visitors from 100 people in scope, a 30% rate.
The simple average is 40%, but the combined rate is 40 visitors ÷ 120 person-days × 100 = 33.3%. Aggregate the counts first, or use a weighted average. State whether your weekly metric uses person-days, distinct people, or the average of daily rates.
Report peaks as well as averages
A weekly average can hide one crowded day and four quiet days. For space and service planning, report the peak daily count, peak utilization, and the day of week alongside the weekly average. Do not infer that a busy day was useful merely because it was busy.

The illustration is qualitative. It shows the same weekly average line crossing five office days while the center day rises well above it. It contains no measured values. The practical point is to inspect the daily distribution before making capacity decisions.
Copy-and-use office attendance reporting template
Create one row for each date, office, and population. Include these fields:
- Date and time window: the period covered.
- Office and area: the location or floor in scope.
- Metric name: planned rate, show-up rate, utilization rate, or plan realization.
- Numerator definition: who or what is counted.
- Denominator definition: people in scope, usable capacity, or planned people.
- Numerator count and denominator count: keep the raw counts beside the percentage.
- Rate: numerator ÷ denominator × 100, with one stated rounding rule.
- Signal and source: plan, manual check-in, badge, Wi-Fi, sensor, or another named source.
- Cutoff and refresh time: when the plan froze and when actual data was processed.
- Exclusions and data gaps: leave, visitors, missing devices, closed areas, or incomplete feeds.
- Owner and note: who can explain the number and what changed.
Weekly summary
At the end of the week, report only the measures tied to a decision:
- Peak planned people and the date.
- Peak observed people and the date.
- Peak utilization and usable capacity.
- Plan realization, planned arrivals, walk-ins, and no-shows.
- Any capacity misses or service changes.
- A short interpretation and the next action.
Avoid publishing an unexplained league table by team. A metric built for space or coordination should not silently become an individual performance score.
Attendance is not the same as useful overlap
A study of 17 agile teams in one large telecommunications company used office access-card data and found substantial variation in team co-presence. High average office presence did not necessarily mean teammates met frequently in person. The geography was not stated on the abstract page.
That distinction changes what to report. If the decision is about collaboration, pair attendance counts with a relevant overlap measure. The office-day overlap worksheet shows how to map critical collaborator pairs. The anchor day checklist helps a team connect shared attendance to purpose, capacity, inclusion, and review.
Make planned attendance visible in Slack
For coordination, a simple plan can be more useful than a delayed analytics report. Officedays posts an office-day message in Slack and lets teammates toggle the weekdays they plan to attend. The Slack attendance tracker guide explains three setup approaches. The Officedays support guide has the current commands, scheduling behavior, and product limitations.
Share planned office days in Slack when the immediate need is teammate visibility. If you also need measured actual attendance, historical reporting, or exports, choose a separate data source and governance process that genuinely supports that use.
Sources and methodology
This article is a public-source synthesis and an editorial reporting framework, not original Officedays research. Sources were checked on July 26, 2026. The worked numbers are transparent illustrative calculations, not customer results or benchmarks. “Plan realization” is an Officedays operational label introduced here and should be defined wherever it is used.
CBRE, The Math Behind the Hybrid Workplace. Published January 2024. Occupancy strategy report with no study sample for its terminology section. Used for the definitions of office attendance, office show-up rate, and office utilization rate. Accessed July 26, 2026.
Microsoft Learn, Configure workplace check-in. Updated July 1, 2026. Official product documentation with no study sample. Used for the distinction between planned and actual work-location signals, user controls, and reporting limitations. Accessed July 26, 2026.
Moe and colleagues, Office Presence and Co-presence. Preprint submitted September 23, 2023. Study of 17 agile teams in one large telecommunications company using office access-card data. Geography not stated on the abstract page. Used only for the presence versus co-presence finding. Accessed July 26, 2026.
Calven Help Center, Analytics. Publication date not shown. Official platform documentation with no study sample. Used for examples of checked-in, walk-in, and no-show categories. Accessed July 26, 2026.
Cisco, Workplace Analytics Design and Implementation Guide. Updated March 31, 2017. Technical implementation guidance with no study sample. Used to explain that badge, Wi-Fi, and sensor signals have different coverage and design limits. Accessed July 26, 2026.