Monday, August 10, 2026
Office Capacity Planning for Hybrid Work: A Practical Worksheet

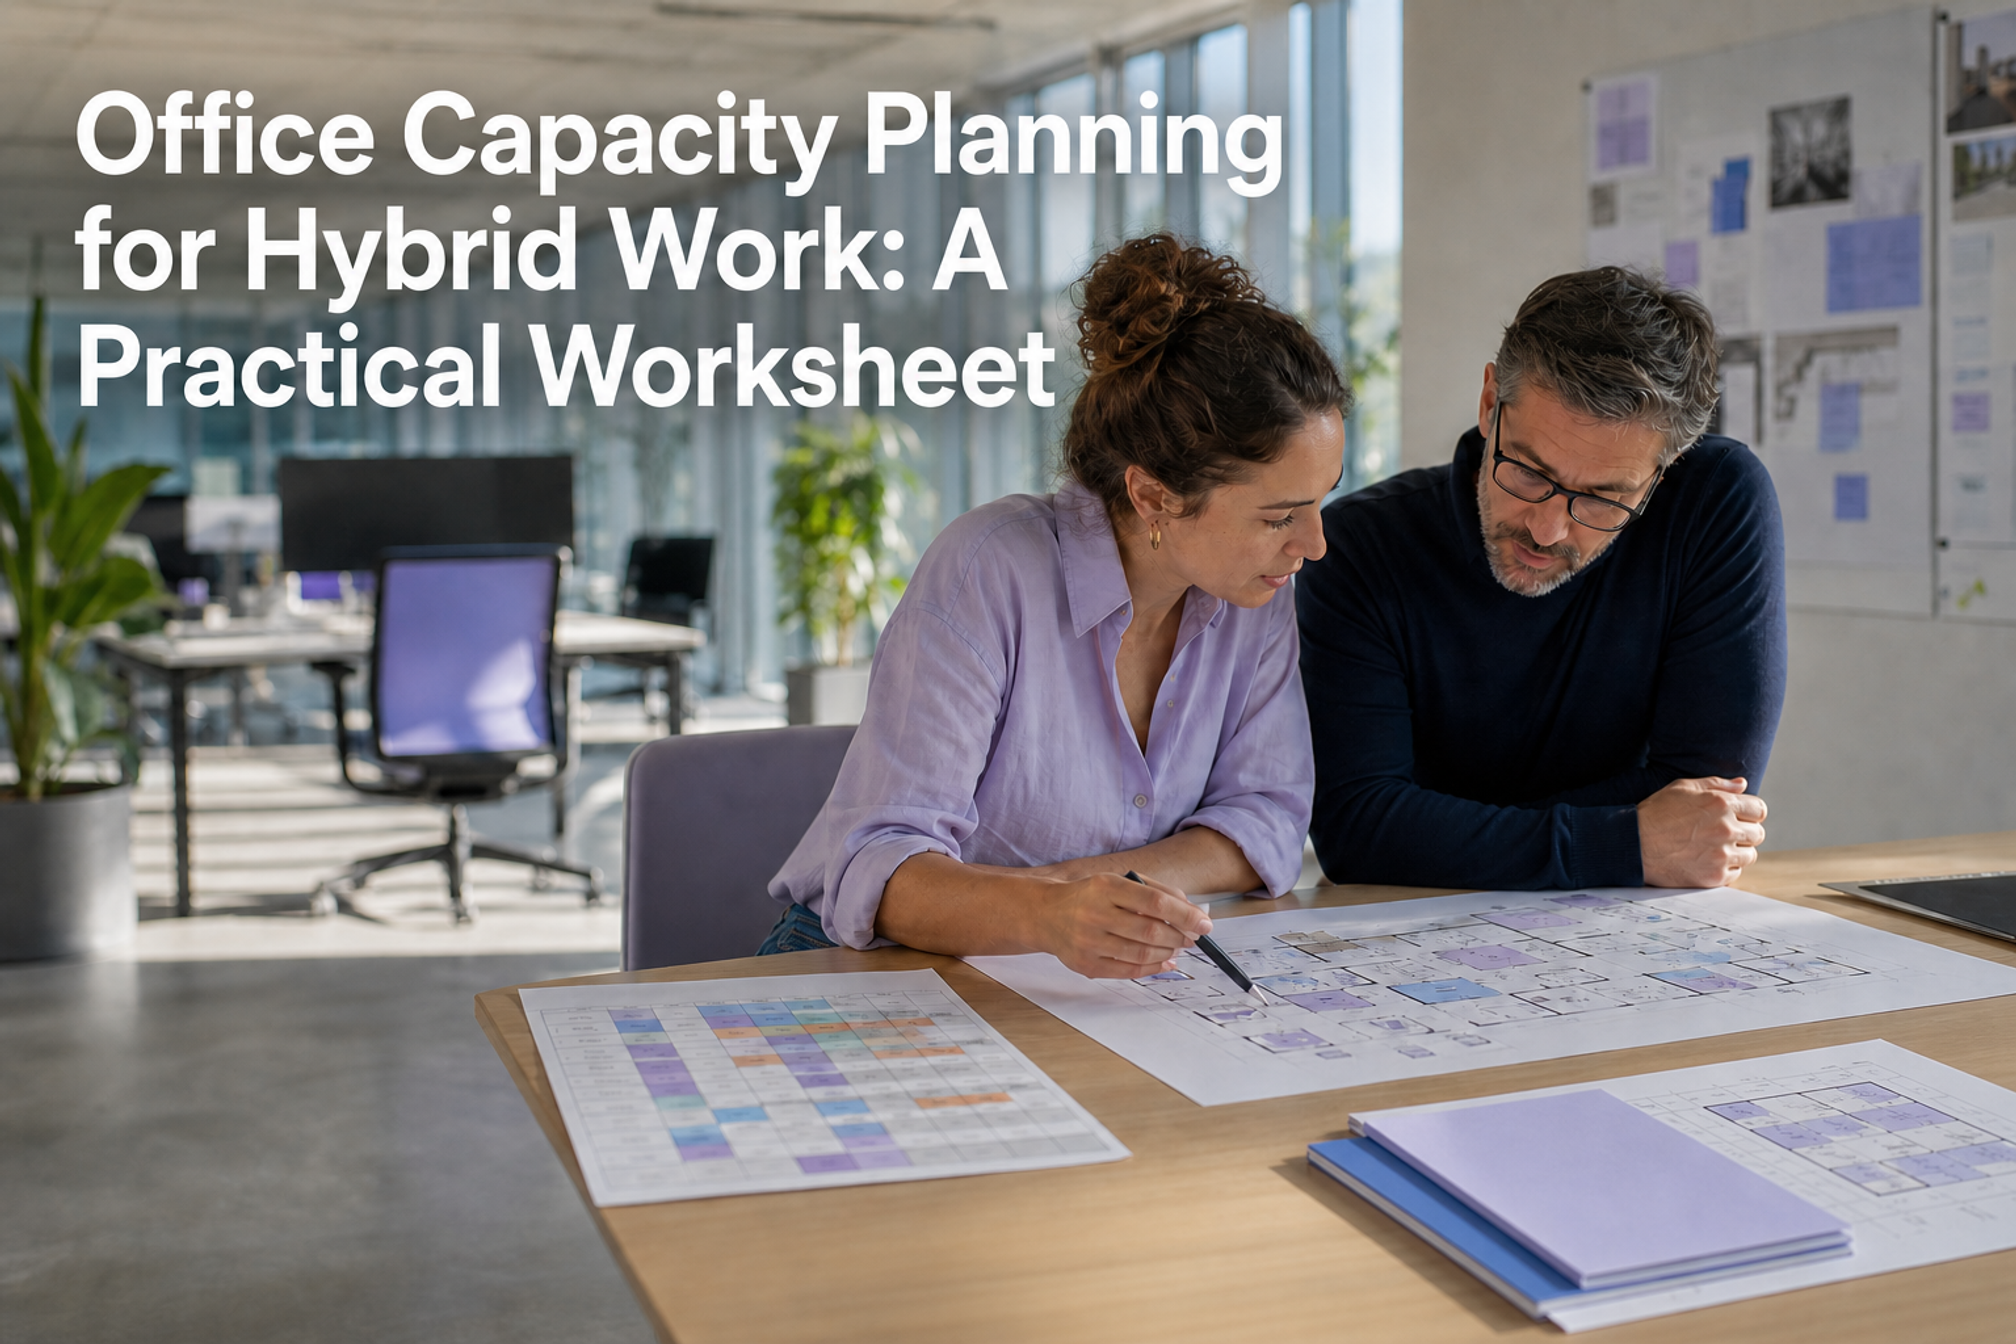
Office capacity planning for hybrid work means matching the people who may arrive, the usable workpoints they can actually use, and the types of space their work requires. Start with daily demand, model the busiest credible day, test activity spaces separately, and keep legal occupancy limits outside your own spreadsheet calculations.
The practical worksheet below turns those inputs into a typical, peak, and change scenario. It is designed for workplace operators, People teams, founders, and office managers who need a planning answer before they need a specialist floor-plan exercise.
Office capacity planning at a glance
- Confirm legal, fire, lease, accessibility, and building limits with the responsible specialists. Treat these as hard constraints, not numbers to estimate from headcount.
- Count only workpoints that are open, equipped, and usable for the people included in the plan.
- Collect daily planned and observed attendance by location. Keep average and peak demand separate.
- Model typical, peak, and change scenarios instead of choosing one desk-to-employee ratio.
- Test desks, meeting rooms, quiet rooms, collaboration areas, and specialist setups as separate supplies.
- Choose a reversible operational response before making an expensive property decision.
Start with four meanings of capacity
A single number called “capacity” hides different constraints. Write all four numbers down before you compare supply with demand.
1. Legal and building capacity
This is the maximum allowed by applicable building, fire, lease, access, and workplace requirements. It can depend on location and the way the space is used. Do not derive it from this worksheet. Record the verified limit, its owner, and the date it was confirmed.
2. Usable workpoint capacity
Count workpoints that a person can use on the day being modeled. Exclude desks that are out of service, missing required equipment, under construction, reserved for another purpose, or inaccessible to the relevant user group. Record fixed and shared desks separately.
3. Attendance capacity
This is the number of people the office can receive for the scenario. Planned attendance shows likely demand. Observed attendance shows what happened. Neither tells you on its own whether people found the right space.
4. Activity capacity
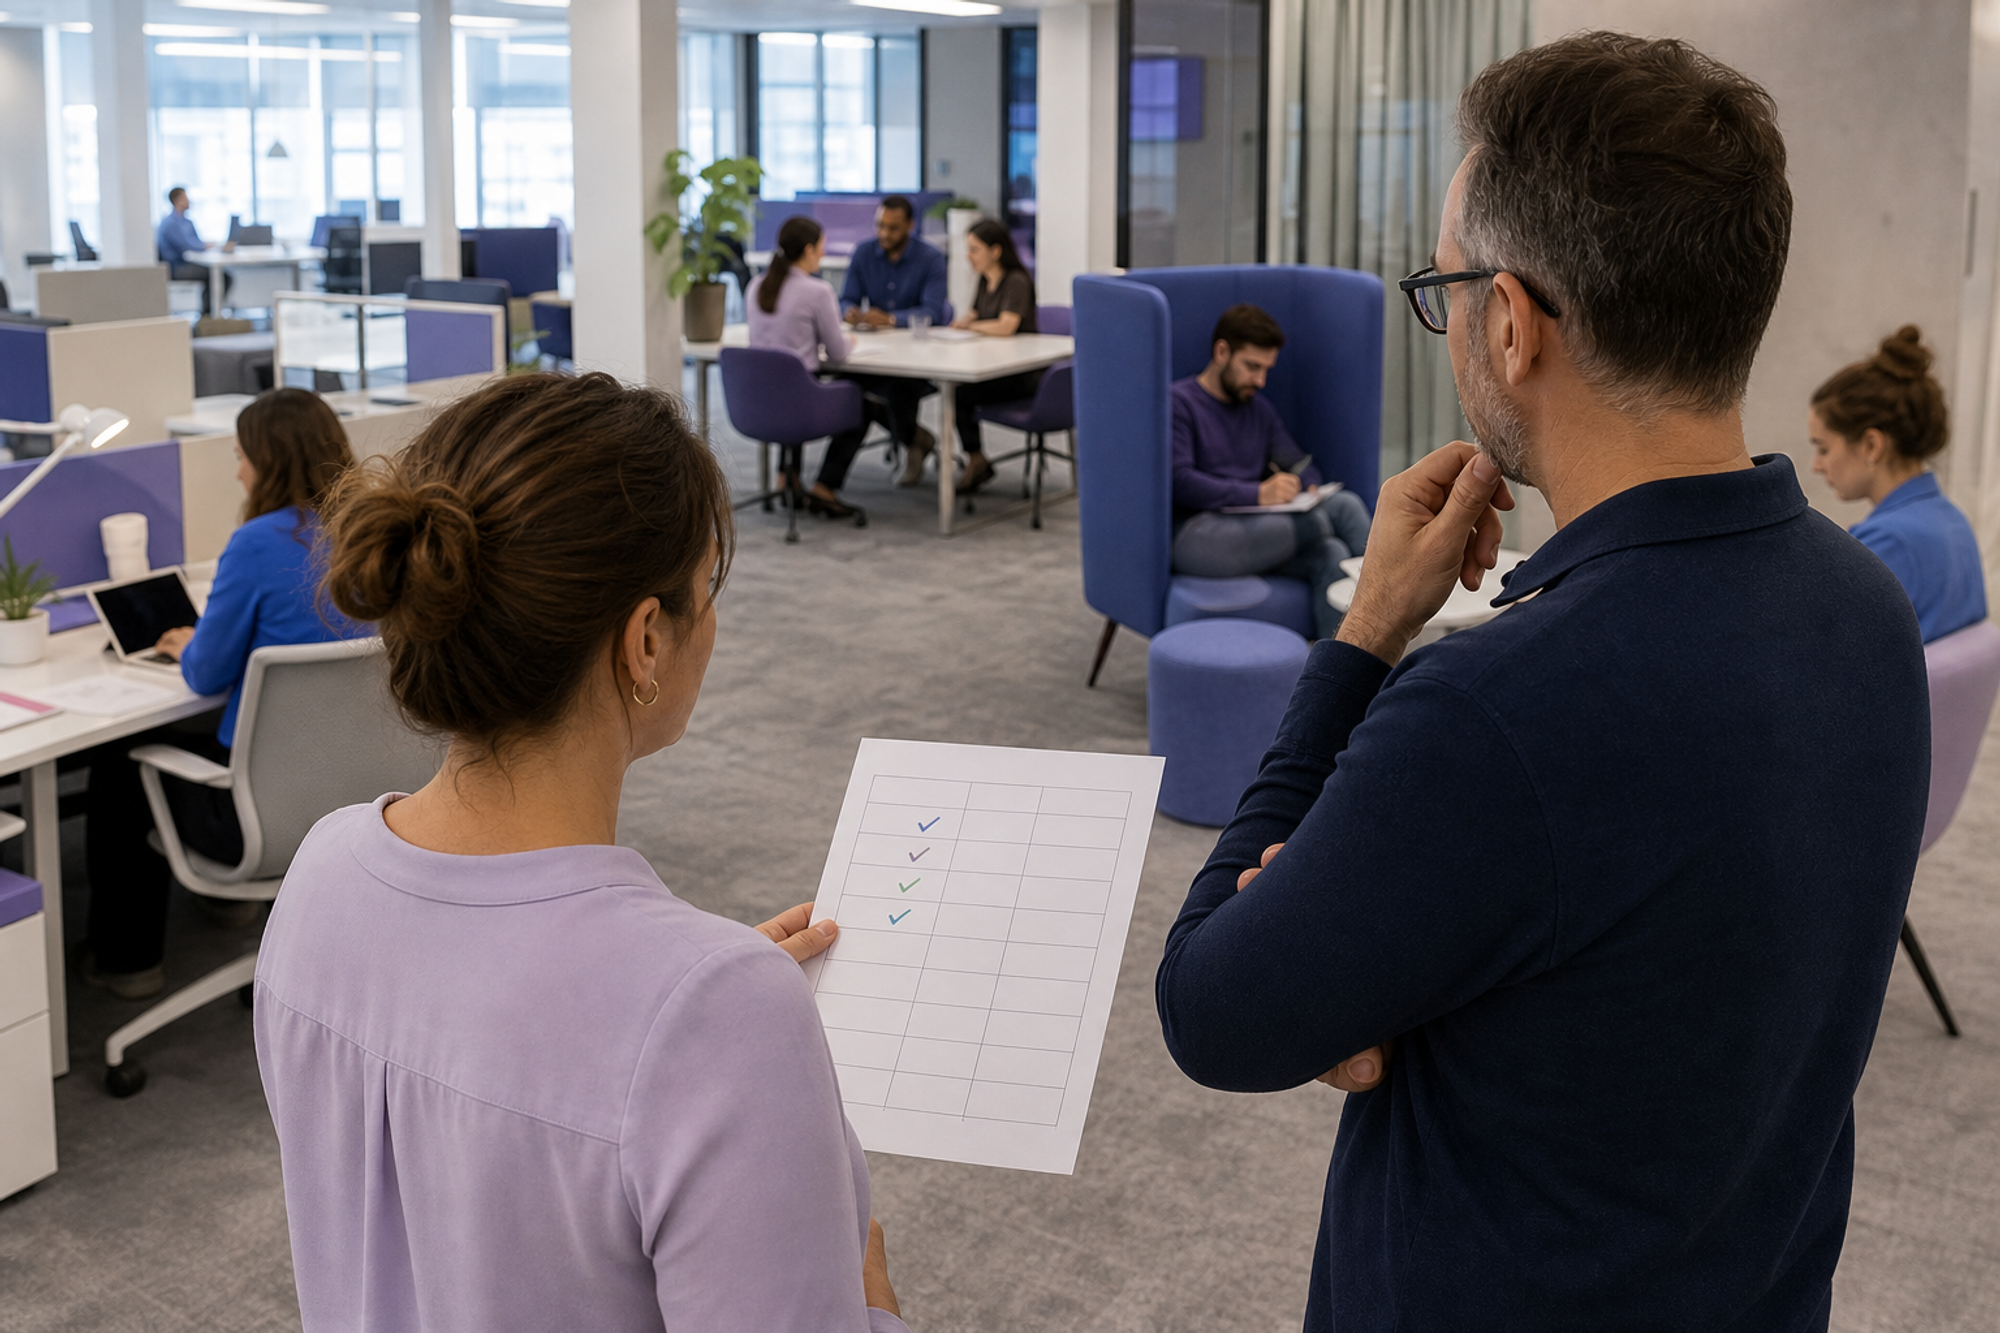
An office with enough desks can still fail if teams cannot find a suitable place for calls, focus, group work, confidential work, or accessibility needs. Current U.K. government workplace guidance emphasizes flexible, inclusive design that can adapt to operational needs. Capacity planning should therefore test the mix of work settings, not just total seats.

Copy-and-use hybrid office capacity worksheet
Copy these sections into a document or spreadsheet. Keep every assumption visible so another person can reproduce the result.
A. Decision frame
- Decision: What choice will this model inform? Examples include opening an overflow area, changing a weekly schedule, repurposing a room, or starting a lease review.
- Location and scope: Which building, floor, team, and dates are included?
- Decision date: When must the choice be made?
- Evidence window: Which ordinary weeks will be used, and which holidays, launches, events, or disruptions will be flagged?
- Owners: Who owns workplace data, people input, facilities constraints, information security, and the final decision?
B. Supply inventory
- Verified legal or building limit: [number, source, owner, confirmation date]
- Usable shared desks: [number]
- Fixed or reserved desks: [number and eligible users]
- Quiet or confidential spaces: [number and practical seats]
- Collaboration spaces: [number and practical seats]
- Video-capable rooms: [number and practical seats]
- Specialist or accessible setups: [number, booking rule, and owner]
- Unavailable or unreliable spaces: [what is excluded and why]
C. Daily demand table
For each weekday, record planned attendees, observed attendees, visitors, contractors, people who need an individual workpoint, expected group activities, and known events. Keep names out of the planning sheet unless there is a clear operational need and an approved handling process.
D. Core calculations
Peak desk demand = people who need an individual workpoint on the modeled peak day + visitors and contractors who need one
Desk coverage = usable shared desks ÷ peak shared-desk demand
Desk capacity gap = usable shared desks − peak shared-desk demand
Space-type gap = usable supply for that space type − peak concurrent need for that space type
A desk coverage result of 1.00 means the shared desk pool exactly matches the modeled demand. Below 1.00 indicates a modeled shortage. Above 1.00 indicates modeled spare supply, but it does not prove that the right desks or other spaces are available in the right place.
E. Assumptions and confidence
- Which data is planned attendance, observed presence, bookings, or employee preference?
- Which days or teams are missing?
- Could a launch, all-hands, visitor group, or seasonal event change the peak?
- Which spaces look available on paper but are often unusable?
- What would make you revise the decision?
Collect demand without creating false precision
The U.S. General Services Administration lists badges, daily check-ins, sensors, Wi-Fi, reservation systems, visual observation, and other occupancy data collection methods. Each method measures something different and can bring security, privacy, coverage, or accuracy limits. The list is useful as a menu, not a requirement for ordinary private workplaces.
New Zealand Government workplace planning guidance recommends examining use over time, high and low use, peak occupancy, patterns through the day, and the activities each space supports. This is the central discipline of the worksheet: pair a count of people with an account of what they needed the workplace to do.
Use the lightest credible data source
- Weekly attendance plans are useful for near-term demand and team coordination, but a plan can change.
- Bookings show reserved demand, but no-shows and unused recurring bookings can overstate presence.
- Access records can show entry, but may not reveal duration, location within a building, or activity.
- Short observations can reveal bottlenecks and unused settings, but they are snapshots.
- Surveys reveal preference and unmet needs, but they are not observed attendance.
Name the source beside every field. If two inputs disagree, keep both visible and investigate the difference instead of averaging it away.
Build three scenarios
Typical scenario
Use an ordinary week with no major event. Model each weekday separately, then identify the typical high day. This is the baseline for routine operations, not a lease decision on its own.
Peak scenario
Use the busiest credible combination of planned attendance, visitors, team overlap, and activities. Check your own busiest-office-day evidence rather than assuming every team follows the same midweek pattern.
Change scenario
Add a specific change such as planned hiring, a new office-day agreement, a team move, or the temporary closure of a floor. State the date and owner for the assumption. A scenario is easier to revise than a hidden forecast.
Worked example: a 60-person team
The following numbers are illustrative. They are not a benchmark or a claim about other workplaces.
- Scope: one office used by 60 employees, with 32 usable shared desks and two separately reserved fixed desks.
- Typical modeled shared-desk demand: 24 on Tuesday, the ordinary high day.
- Peak modeled shared-desk demand: 31 on a Tuesday with a team workshop and two visitors.
- Change scenario: 34 shared-desk users after a planned team move.
- Peak concurrent quiet-room need: four, with two suitable rooms available.
Peak desk coverage = 32 ÷ 31 = 1.03
Peak desk gap = 32 − 31 = +1 desk
Change-scenario desk coverage = 32 ÷ 34 = 0.94
Change-scenario desk gap = 32 − 34 = −2 desks
Peak quiet-room gap = 2 − 4 = −2 rooms
The peak scenario fits the shared desk pool by one desk, but the office still has a quiet-room bottleneck. The change scenario creates a two-desk shortage. The useful decision is not “our ratio is good.” It is to test whether the peak can be spread, whether another setting can safely serve as overflow, whether quiet capacity can be changed, and when a space change becomes necessary.
Use a decision ladder before changing space
- Improve forward visibility. Make next week’s planned attendance visible early enough for teams and workplace operators to act.
- Separate a demand problem from a coordination problem. Use an office-day overlap worksheet when the goal is useful co-attendance rather than maximum occupancy.
- Correct data quality issues. Remove unavailable desks from supply, flag unusual weeks, and distinguish a booking from actual use.
- Adjust operations. Trial different event days, open an overflow zone, repair unreliable equipment, or publish clearer space guidance.
- Test a small physical change. Reconfigure or repurpose one area before changing the whole floor.
- Escalate property decisions. Bring facilities, finance, building, safety, accessibility, and design specialists into high-cost or regulated changes.
Run a peak-day test
A model should survive a real office day before it drives an expensive decision. Choose a credible peak day and run a simple observation test.
- Publish the expected attendance and known activities in advance.
- Confirm which workpoints and rooms are actually open and usable that morning.
- Observe at consistent times, including the expected peak, without collecting more personal data than the decision needs.
- Record full areas, unused areas, unavailable equipment, work moved elsewhere, and people searching for space.
- Ask a short follow-up: Could you find the setting you needed, and what did you use the office for?
- Compare planned attendance, observed presence, desk demand, and activity-space demand.
- Repeat if the day was disrupted or if the result would trigger a costly change.
Do not copy a universal office ratio
Published occupancy and space ratios are created for particular estates, rules, measurement definitions, and policy goals. For example, current U.S. federal occupancy reporting guidelines define what covered agencies must count and report. Those definitions do not automatically become a planning target for a private workplace in another country.
Use external benchmarks to ask questions, not to close the decision. Write down how the benchmark defines people, space, time, and utilization. If any definition differs from your own, do not compare the numbers without qualification.
Final capacity planning checklist
- The legal and building limits are verified outside the model.
- Only usable workpoints are counted as supply.
- Fixed, shared, specialist, and unavailable desks are separated.
- Daily demand is modeled by location and weekday.
- Average demand is not used as a substitute for peak demand.
- Desk demand and activity-space demand are calculated separately.
- Typical, peak, and change scenarios are visible.
- Every input names its source and evidence window.
- Illustrative assumptions are labeled and easy to replace.
- A reversible test comes before a high-cost change.
Make weekly attendance visible
A capacity plan gets more useful when forward attendance is easy to update. Compare planned and observed counts with a consistent office attendance rate formula, then use a productive office-day agenda to check whether the space mix supports the work people came together to do.
Officedays helps teams share their planned office days and see who expects to be in, directly in Slack. That forward view can supply one practical demand signal for the worksheet. See Officedays in Slack.
Sources and methodology
USE IT Act and occupancy data (U.S. General Services Administration, updated July 8, 2026). Used for the list and limitations of occupancy data collection methods.
Occupancy and utilization reporting guidelines (U.S. General Services Administration, updated March 17, 2026). Used to illustrate that occupancy definitions and reporting periods are context-specific.
Understanding the current state (New Zealand Government Property Group, publication date not stated, current site accessed August 10, 2026). Used for utilisation-study inputs, including peaks, patterns, and activities.
The Government Workplace Design Guide (U.K. Government Property Agency, published October 13, 2020, updated July 2, 2026). Used for flexible, inclusive, operationally responsive workplace design context.
Methodology: Officedays reviewed primary government guidance and current search results on August 10, 2026, then built a practical synthesis for hybrid workplace planning. The formulas are transparent definitions, and the 60-person example is illustrative. This article is not original research, a legal capacity calculation, a fire-safety assessment, an accessibility assessment, or a substitute for local workplace and building specialists.